Configuring Defender for DevOps on GitHub
TL;DR
Enable connector in Defender for Cloud. Add analyze workflow. See scan results in dashboard.
Defender for DevOps
DevSecOps and shift security left has been an important part of infrastructure development for a while now. We have quite a few tools to use, but now we can also connect Defender for Cloud to our pipelines! Defender for DevOps is a connection from our CI/CD pipelines to Defender for Cloud with insights and recommendations. Defender for DevOps integrates with GitHub Advanced Security that is embedded into both GitHub and Azure DevOps, to empower security teams with the ability to protect resources from code to cloud.
This means that Defender for DevOps utilized existing functionality to bring visibility into Defender for Cloud dashboard. Toghether with this launch, Microsoft also launched GitHub Advanced Security for Azure DevOps. I already mentioned this in a previous post.
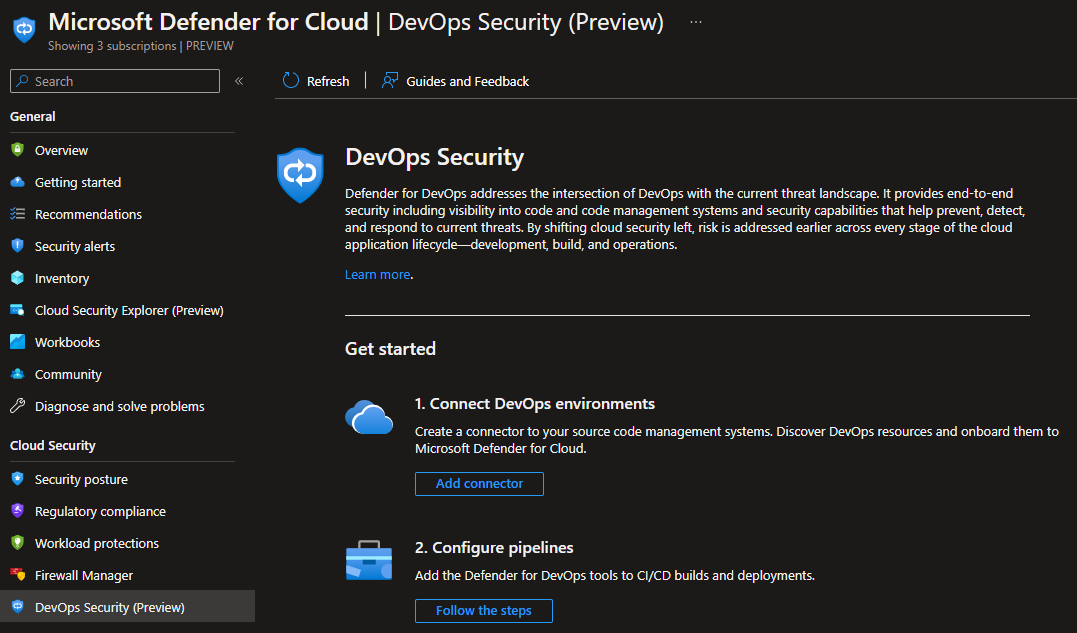
Enable for GitHub
There are some steps to configuring this with GitHub, and I will show you the outline in this post. One of my colleagues already posted about configuring this for Azure DevOps.
Enable GitHub Advanced Security
Before you can start getting information and insights into Defender for Cloud, you need to enable GitHub Advanced Security (if you haven’t already). This is fairly straight forward, and doesn’t seem to cost anything for public repositories. If you are an organization, you need to check licensing and pay for Enterprise functionality to enable on private or internal repos. Make sure you are logged on with your account before doing the list below.
(Optional) Navigate to your code security and analysis settings, and enable all the features. This will enable Dependabot for your user, and you get scheduled scan reports. This is not needed for code scanning, but can be useful to have either way.
Go to a repository you want to integrate with Defender for DevOps, and choose the “Settings” tab and “Code security and analysis” in the left menu. Enable the code scanning features.

You have now enabled scanning your code in the chosen repository, and GitHub will check for common vulnerabilities and coding errors. You will also get notified if secrets are checked into the repository.
Enable GitHub connector
Before Defender for Cloud can connect to GitHub and read the results of your scans, you need perform a connection from Defender for Cloud to GitHub.
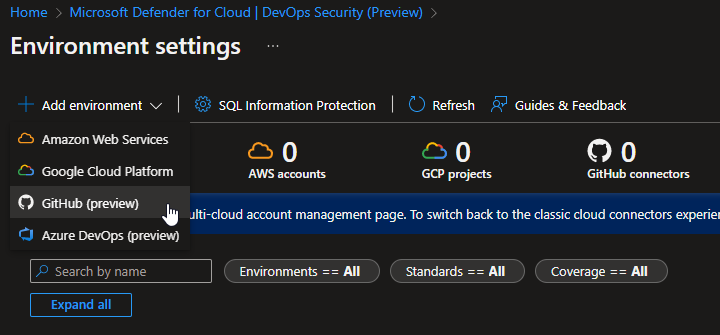
Navigate to your Defender for Cloud DevOps Security dashboard, and choose the “+ Add Environment” dropdown.
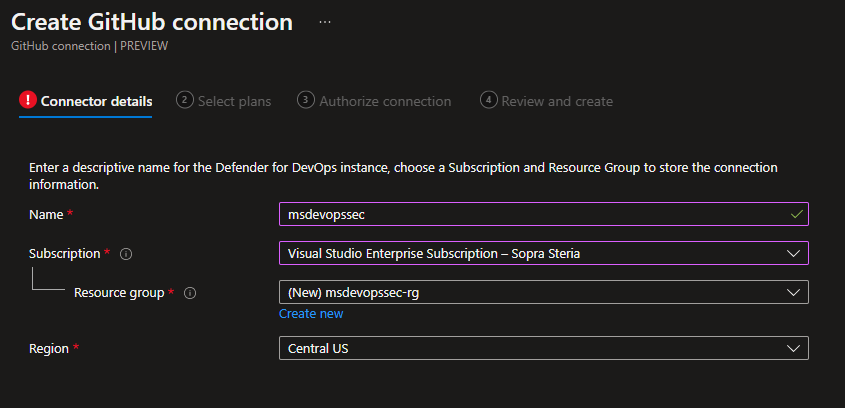
Enter some info to create a connector resource. You should write something descriptive here, so you will recognize the resource later. Observe your own naming conventions.
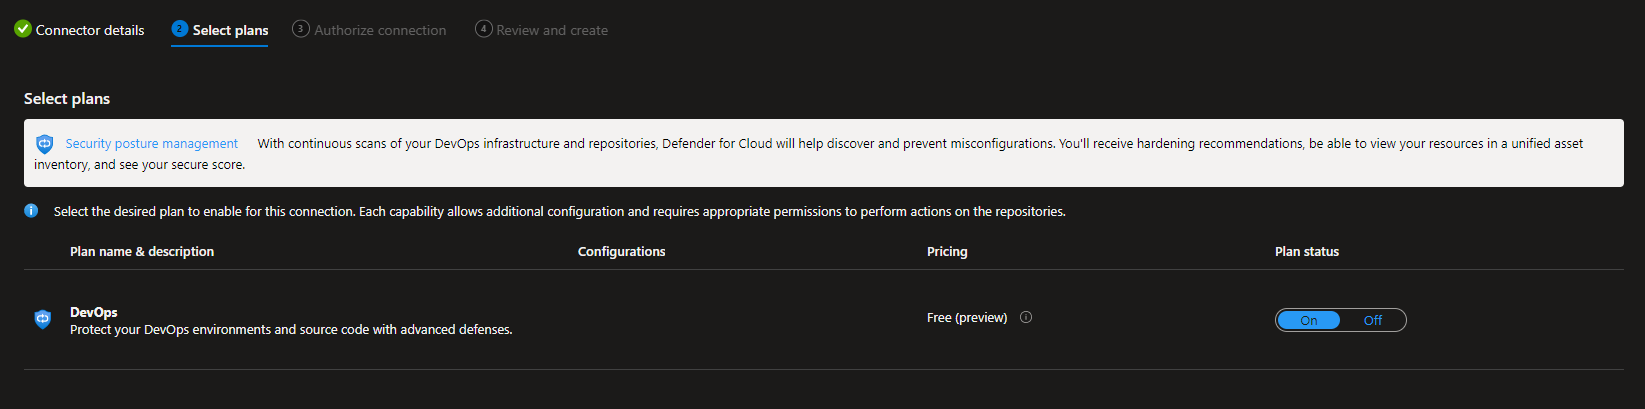
Select a DevOps plan. This is simple at the moment, and you can only choose on or off. At a later stage, this might include different code scanning levels++.
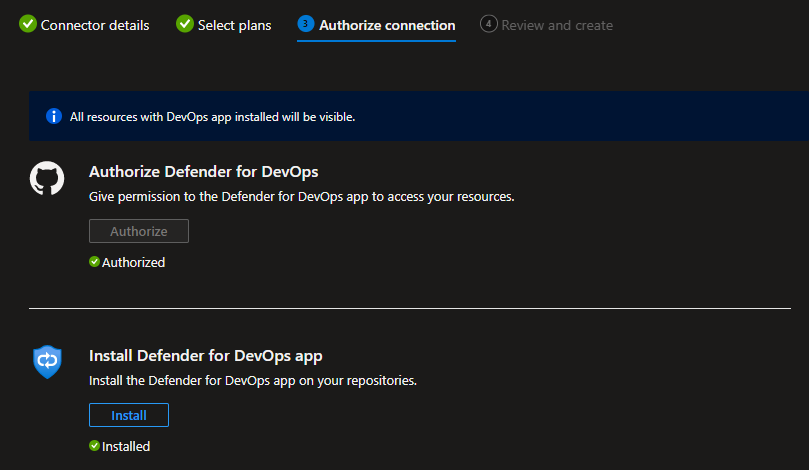
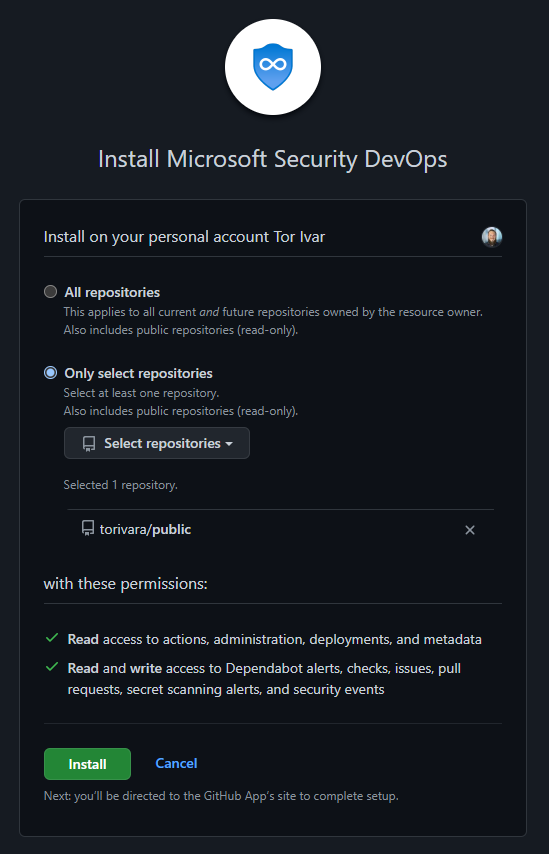
Then you need to authorize Defender for Cloud to access your repository, and install the Defender for DevOps App. I chose to install this only in a chosen repository, but you can do this for all your repositories if you want. This is just a proof of concept for me, and I might run the scanner on my public repository for a while just to see how it works. You should determine where you want to run the scanner, and plan accordingly.
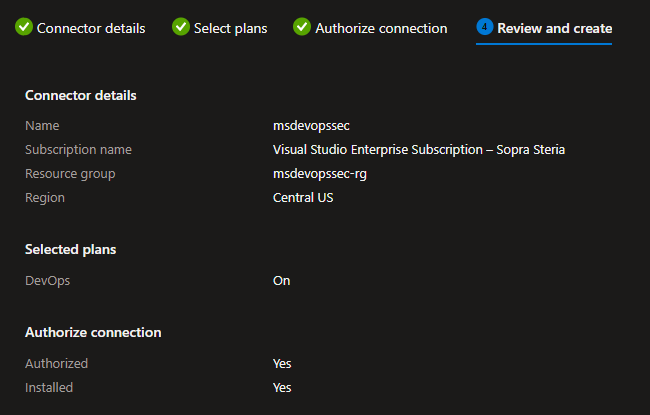
Then review and create your configuration.
After this you have successfully connected Defender for DevOps to your GitHub repository. You will, however, not get any code scanning results yet. For this you need to configure a workflow that scans your repository. This is the next step.
Configure workflow
You can find the workflow I am using here. Copy the file, and paste it in your workflows folder on the repository you connected earlier.
The path should be your-repository-url/main/.github/workflows/msdevopssec.yml. Please note that my repository is old, and there are several pointers to it. Therefore it still has the old “master” branch name, but I have updated the workflow to work with both main and master branch name. If you have a different name on your main branch, you need to update the triggers in the workflow.
Check results
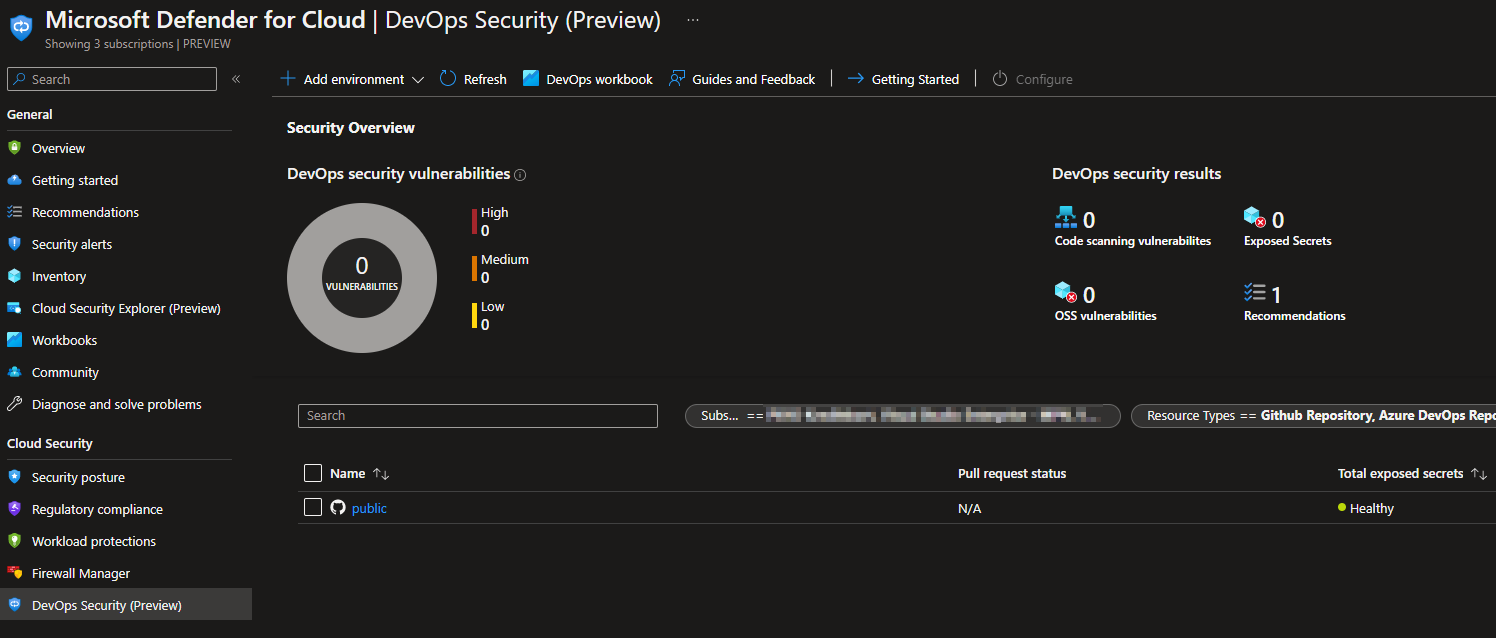
After a little you should be able to see results in your Defender for Cloud DevOps Security dashboard.
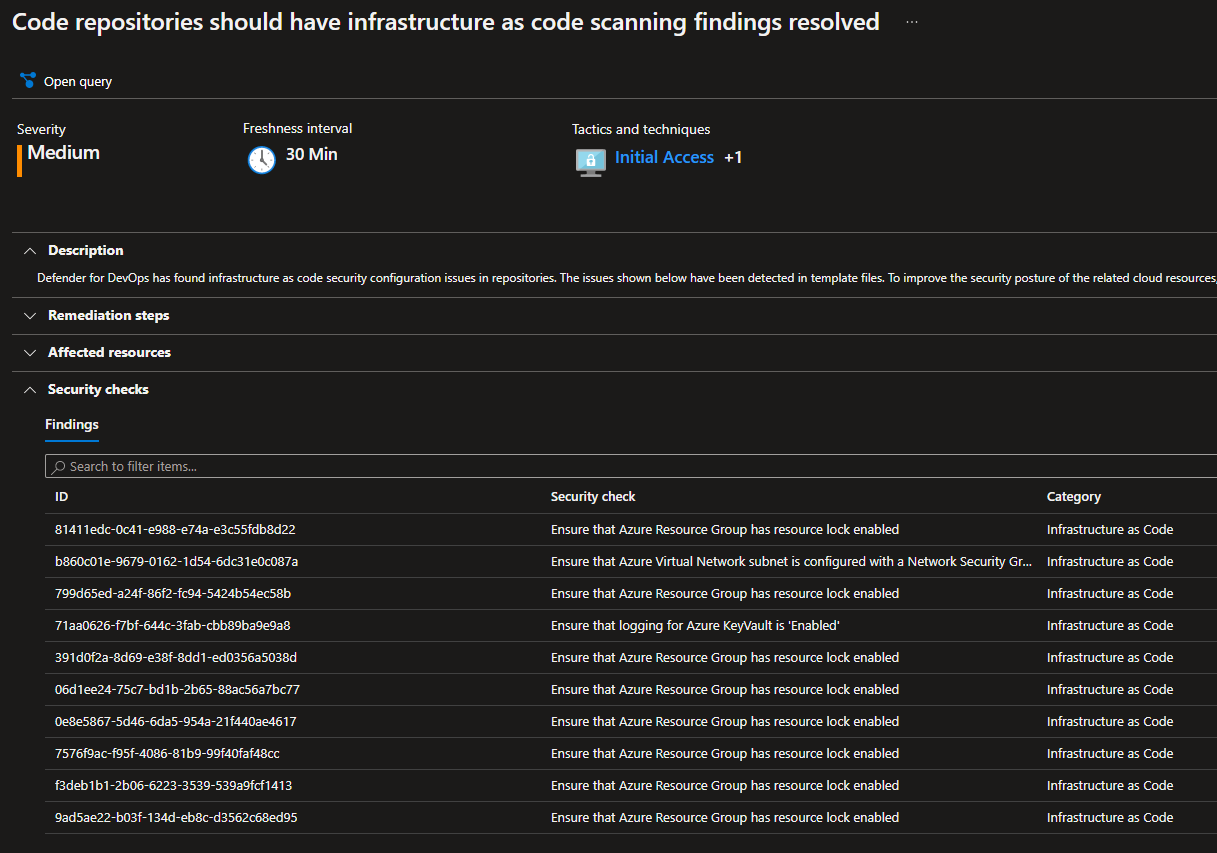
Example of a recommendations list
Exceptions and rule changes
So, my list of recommendations is kind of filled because I have purposefully created insecure configurations. There are however recommendations I do not agree with, and in those cases we can use exceptions or disable specific rules. I will try to show an example of this below.

The highlighted recommendations complain that I am not using Resource Locks. I generally don’t use a lot of resource locks, because they can complicate operations and some automatic Azure services. Therefore this recommendation needs to be excempted in my case. I will try to exclude this rule by config.
You can see the different options for running the workflow in the wiki here. There are several different scans running, but the one I am interested in is Terrascan. I will try to exclude a rule when running, as this can be done in several different ways.
To find the necessary information which I can exclude, I go into the recommendations and find the relevant one.

I can see from this information that the rule AC_AZURE_0389 needs to be excluded to remove RG locks recommendation. Just to get a set of rules to exclude, I will also exclude a random K8S rule. As you can see below, I have opted for excluding the rules by using Terrascan environment variables.
The YAML code snippet for excluding rules in Terrascan:
# Run analyzers
- name: Run Microsoft Security DevOps Analysis
  uses: microsoft/security-devops-action@preview
  env:
    terrascan_SkipRules: "AC_AZURE_0389,AC_K8S_0069"
  id: msdo
You can see here that the rules are now excluded:

In summary
I think it’s great that Microsoft continues to innovate on DevSecOps and simplify the security part of development lifecycle. The feel of using this functionality is great, and this might start many development teams on their journey to a more secure development environment. GitHub Advanced Security is a nice piece of security tech, and it is now also available in Azure DevOps.
Defender for Cloud serves as the central dashboard where alerts and events are surfaced and highlighted. Microsoft Sentinel can be connected to this and process any events or alerts from Defender for Cloud. All in all a great addition to the security toolbox!