Custom log ingestion with Azure Log Analytics Workspaces and Data Collection Endpoints

TL;DR
Fortify your Azure Monitoring with custom log ingestion to log analytics workspaces! You only need a workspace, data collection endpoint, and a data collection rule. Terraform example code available here
Background
Sometimes the need arises where a session must be logged and correlated across several services. The session could start in an application gateway, continue to a web app, and use some sort of backend services further down the line. If any session has errors, you want to be able to trace it from entering the app gateway all the way to which service they were using and where it failed. Custom log ingestion can really help in this case, as you can log events with some sort of correlationId that can be matched across services.
No Azure Monitor Private Link Scopes (AMPLS) are configured here, and it will not be enabled for this project. The enabling of AMPLS could potentially lead to a full stop of tenant logging, so we would want to plan the AMPLS implementation more before starting it. This would require heavy changes to Azure Monitoring in the environment, as DNS changes when AMPLS is enabled.
Either way, I have configured custom log ingestion recently, and had a hard time getting it to work. Hopefully I can save someone some time with these examples and guides.
Prerequisites for testing
If you want to test this yourself, you need the following available:
- An Azure account
- An active Azure subscription
- Terraform
- Azure CLI
We will be doning things easy with no service principals or remote states this time.
Deployment
Terraform config
Some basic configuration is needed to run Terraform. Provider constraints and versions mostly, but also a random_pet resource for naming purposes.
terraform {
  required_version = ">=1.5"
  required_providers {
    azurerm = {
      source  = "hashicorp/azurerm"
      version = "~>3.0"
    }
    azapi = {
      source  = "Azure/azapi"
      version = "~>1.0"
    }
  }
}

provider "azurerm" {
  features {}
}

provider "azapi" {}

resource "random_pet" "pet" {
  length    = 2
  separator = "-"
}
Log Analytics Workspace
We will be creating a basic Log Analytics Workspace (LAW) for this test. LAWs contain your logs in a structured manner, and stores them in what is called tables. Azure Diagnostics has historically been stored in a table called “AzureDiagnostics”. Azure Activity Log is stored in a log called “AzureActivity”. Log analytics is a major topic, and I will not be covering the basic stuff in this post. You can find more information on LAWs here.
Deploy a basic workspace and resource group with Terraform:
resource "azurerm_resource_group" "rg" {
  location = "norwayeast"
  name     = "rg-lawtest-${random_pet.pet.id}"
}

resource "azurerm_log_analytics_workspace" "workspace" {
  location            = azurerm_resource_group.rg.location
  name                = "log-${random_pet.pet.id}"
  resource_group_name = azurerm_resource_group.rg.name
}
Data Collection Endpoint
Log Analytics data ingestion usually goes in the background with pre-existing endpoints created with the workspace. This is traffic you don’t see, as it works with agents and builtin diagnostic settings for services. Most of them even circumvents firewalls (for PaaS), but if you are using virtual machines you will have to enable firewall exceptions for Azure Monitor. All of this traffic goes to builtin endpoints in the LAW itself.
When you want to write custom logs to a LAW, you can’t send them directly to any default endpoint. You need to create a Data Collection Endpoint (DCE), and this endpoint needs to be associated with a Data Collection Rule. More on the rules later.
Creating the DCE is quite straightforward. Use Terraform:
resource "azurerm_monitor_data_collection_endpoint" "custom_tables_dce" {
  location                      = azurerm_log_analytics_workspace.workspace.location
  name                          = "dce-${azurerm_log_analytics_workspace.workspace.name}"
  description                   = "Data Collection Endpoint for ingestion to custom tables in log analytics workspace."
  resource_group_name           = azurerm_log_analytics_workspace.workspace.resource_group_name
  public_network_access_enabled = true
}
New information regarding need for DCE: You only need a DCE if you are using private link (AMPLS) for new DCRs! This must have been released recently because just yesterday (May 13th) I did not see any indication in the docs. More info here.
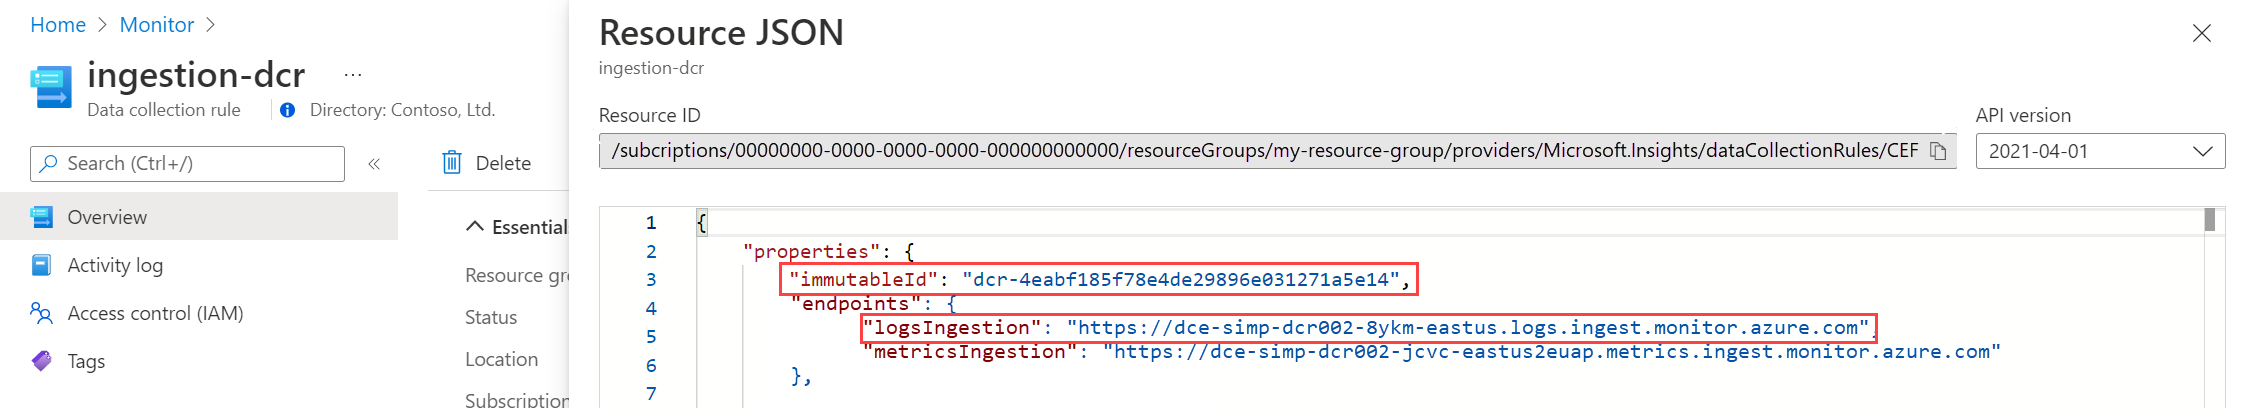
All my testing has been with a DCE, so this post will still be using a DCE. If using the builtin endpoint in the DCR, you can find the log ingestion endpoint using “JSON View” in the portal on the DCR.
The endpoints property MS is referring to in the following picture, does not exist on my DCRs created very recently.
Custom table
To ingest custom logs into LAW you need to create a custom table. This is currently not possible with AzureRM so I have used the AzAPI provider. One might also have used the ARM deployment, but AzAPI is a better solution for many reasons. When doing terraform deployments I use this priority strategy: AzureRM > AzAPI > ARM Template Deployment.
Custom tables need a schema. It is defined in JSON, but I chose to create a terraform local variable for this. The terraform local variable I have used is also used to define properties in the Data Collection Rule, and it was easier to work with than a JSON string.
When defining a custom table via the Azure Portal you only need a sample of the data you want to ingest. Automatic processes will determine the schema based on your data. When doing this in terraform, you need to prepare a schema. More information here.
Define the schema in a local variable(a list of objects to enable creation of more than one custom table):
locals {
  custom_tables = [
    {
      name = "mytable_CL",
      schema = {
        name = "mytable_CL",
        columns = [
          {
            name        = "TimeGenerated",
            type        = "datetime",
            description = "The time at which the data was generated"
          },
          {
            name        = "column1",
            type        = "string",
            description = "Column 1"
          },
          {
            name        = "column2",
            type        = "string",
            description = "Column 2"
          }
        ]
      },
      retention_in_days       = 30,
      total_retention_in_days = 30
    }
  ]
}
An important detail here is that the table name and schema name must be identical (
mytable_CLin the example) and end with_CL. This is required for successful deployment. You decide which columns are needed and what format they are (string, int, datetime, ++).
You can add columns here as necessary. You can’t create a column called “time” because this is reserved by Microsoft. If you want to have some time data sent with your event payload, look at the DCR below. You need to modify the transformKql property.
Create the custom table using AzAPI:
resource "azapi_resource" "custom_tables" {
  for_each  = { for v in local.custom_tables : v.name => v }
  name      = each.key
  parent_id = azurerm_log_analytics_workspace.workspace.id
  type      = "Microsoft.OperationalInsights/workspaces/tables@2022-10-01"
  body = {
    properties = {
      schema               = each.value.schema
      retentionInDays      = each.value.retention_in_days
      totalRetentionInDays = each.value.total_retention_in_days
    }
  }
}
Notice I am using the new Dynamic Properties for AzAPI provider! No jsonencode of the properties. You need to be at or above provider version 1.13 to use this.
Data Collection Rule
The Data Collection Rule (DCR) is crucial for sending the log events to the correct table, and performing the necessary transformations. The easiest transformation I have seen is using kusto function now() for generating the content in the TimeGenerated column. You can also do more complex transformations, but I will not cover it in this post.
In our case the DCR defines:
- A destination (the workspace)
- A data flow (custom table datastream to the aforementioned workspace)
- A stream declaration (how are the event payloads structured)
Stream declaration is dependent on your custom table schema, so be aware of this. The terraform example below uses a local variable for custom table, and can therefore dynamically create the stream declaration. If you change the schema in custom_tables, the stream_declaration will automatically be correct (in most cases).
Create a DCR with terraform:
resource "azurerm_monitor_data_collection_rule" "custom_log_ingestion_rules" {
  for_each                    = { for v in local.custom_tables : v.name => v }
  location                    = azurerm_log_analytics_workspace.workspace.location
  name                        = "dcr-${replace(lower(each.key), "_", "-")}-${azurerm_log_analytics_workspace.workspace.name}"
  resource_group_name         = azurerm_log_analytics_workspace.workspace.resource_group_name
  data_collection_endpoint_id = azurerm_monitor_data_collection_endpoint.custom_tables_dce.id

  destinations {
    log_analytics {
      workspace_resource_id = azurerm_log_analytics_workspace.workspace.id
      name                  = azurerm_log_analytics_workspace.workspace.name
    }
  }

  data_flow {
    streams       = ["Custom-${each.key}"]
    destinations  = [azurerm_log_analytics_workspace.workspace.name]
    transform_kql = "source | extend TimeGenerated = now()"
    output_stream = "Custom-${each.key}"
  }

  stream_declaration {
    stream_name = "Custom-${each.key}"
    dynamic "column" {
      for_each = each.value.schema.columns
      content {
        name = column.value.name
        type = column.value.type
      }
    }
  }
}
If you want to use a timestamp from your payload transform_kql must be changed to transform_kql = “source | extend TimeGenerated = now(timestamp)”, and you need to add a timestamp of format datetime UTC to your payload. This can be practical if you are dependent on a separate timestamp to see exactly when the event happened. Ingestion time can potentially add some time to the “TimeGenerated” column when done like defined in this example. This is because the timestamp is currently generated on ingestion, and not from the actual event. If you have 10 minutes from event happened to log ingestion, the TimeGenerated will be 10 minutes after the event happened.
Permissions
If you want to send payloads to the LAW via DCR/DCE, you need a specific permission on the DCR. Setting the permission can be done with terraform:
data "azurerm_client_config" "current" {}

resource "azurerm_role_assignment" "metrics_publisher" {
  principal_id         = data.azurerm_client_config.current.object_id
  scope                = azurerm_resource_group.rg.id
  role_definition_name = "Monitoring Metrics Publisher"
}
If your web app or other managed identity needs access, you only need to change the principal id to reflect either service principal or managed identity object id. As always use the principle of least privilege, and grant the access where it is needed. Preferrably only on your DCR. In the example above the role assignment is made at the resource group scope for simplicity. I would change the scope to the DCR resource id for production environments.
Testing
To test your custom log ingestion, you need access to a cli that can send POST requests. You also need the correct permissions, and the correct endpoint information.
In my case, I ran the terraform deployment with my user (logged in with az login before terraform commands). The role assignment above grants my user Monitoring Metrics Publisher, which gives permissions to write events into LAW.
If you want an easy way of reading the endpoint info, you can use this output in your terraform:
output "log_ingestion_endpoints" {
  description = "Computed log ingestion endpoints pr. data collection rule with DCR immutable ID included"
  value       = { for v in azurerm_monitor_data_collection_rule.custom_log_ingestion_rules : "log_endpoint_${v.name}" => "${azurerm_monitor_data_collection_endpoint.custom_tables_dce.logs_ingestion_endpoint}/dataCollectionRules/${v.immutable_id}/streams/${v.data_flow[0].streams[0]}?api-version=2023-01-01" }
}
It outputs the url needed to send data into your LAW using REST.
Testing can be done with curl (since I am testing this in Linux, and have curl handy):
az login
curl -S \
    --header "Authorization:Bearer $(az account get-access-token --query accessToken --scope "https://monitor.azure.com//.default" -o tsv)" \
    --header "content-type: application/json" --request POST \
    --data '[{"column1":"test123","column2":"test456"}]' \
    "https://<endpoint url>/dataCollectionRules/<dcr immutable id>/streams/<stream name>?api-version=2023-01-01"
The bash command above will fetch an access token with az account get-access-token inline. It is valid for the relevant scope (monitor), and will grant permission to send payloads to LAW (if you have assigned the role). Please wait at least 10 minutes after creation and granting permissions before testing. You might get an error stating unauthorized, but this should pass by itself if you have configured permissions correctly. Otherwise, check your permissions and the url.
If using this in a web app, you can send the payload with this command:
curl -H "X-Identity-Header: $IDENTITY_HEADER" "$IDENTITY_ENDPOINT?api-version=2019-08-01&resource=
https://monitor.azure.com"
$IDENTITY_HEADER and IDENTITY_ENDPOINT are environment variables in your web app.
More info about connecting from an app service to Azure services with managed identities.
There might be some initial wait time for log ingestion to the custom table. The first few events could take some time to create. In my experience anything from 10 minutes to 1 hour can be normal. You should expect to be in the lower end of that scale, though. Microsoft mentiones somewhere that the first events could take a few hours. I have not seen that in testing.
More information
Some external links for reference:
- Log ingestion tutorial
- Data Collection Endpoints
- Logs ingestion api
- AzAPI terraform example
- Sample code for log ingestion
- The AzAPI provider
- A great writeup of DCR and transformations
- Troubleshooting log ingestion is hard
In summary
Using custom log ingestion in Azure Log Analytics can be challenging, but with this post you might save some time on your implementation. I hope you found the information provided useful 😊
In any case this post will serve as a form of noteToSelf. Please leave comments and criticism if you see something incorrect/insecure/inaccurate!